

Assasin
No content yet
Assasin
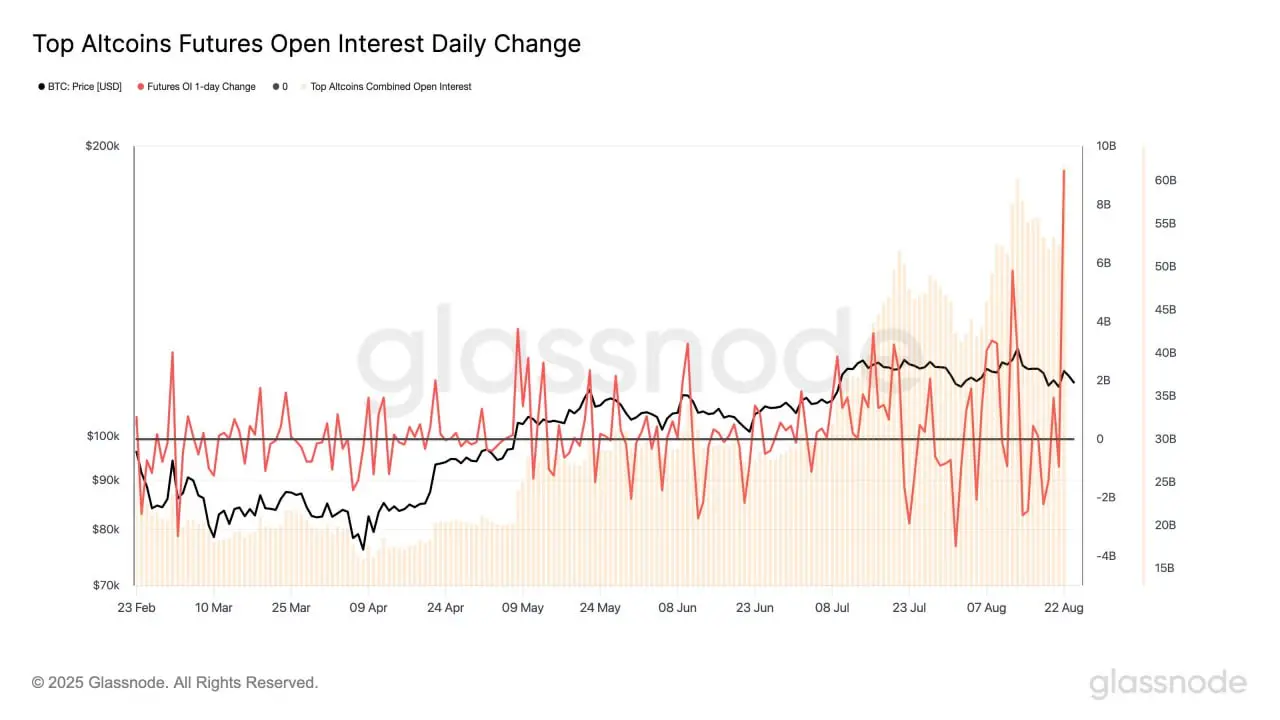
Altcoin Futures OI Hits Record High
Altcoin futures open interest surged by +$9.2B in a single day on Friday, driving the combined total to a new ATH of $61.7B.
This rapid influx of capital underscores how altcoins are increasingly fueling leverage, volatility, and fragility across the broader digital asset market.
Altcoin futures open interest surged by +$9.2B in a single day on Friday, driving the combined total to a new ATH of $61.7B.
This rapid influx of capital underscores how altcoins are increasingly fueling leverage, volatility, and fragility across the broader digital asset market.
IN-0.46%
- Reward
- like
- Comment
- Repost
- Share
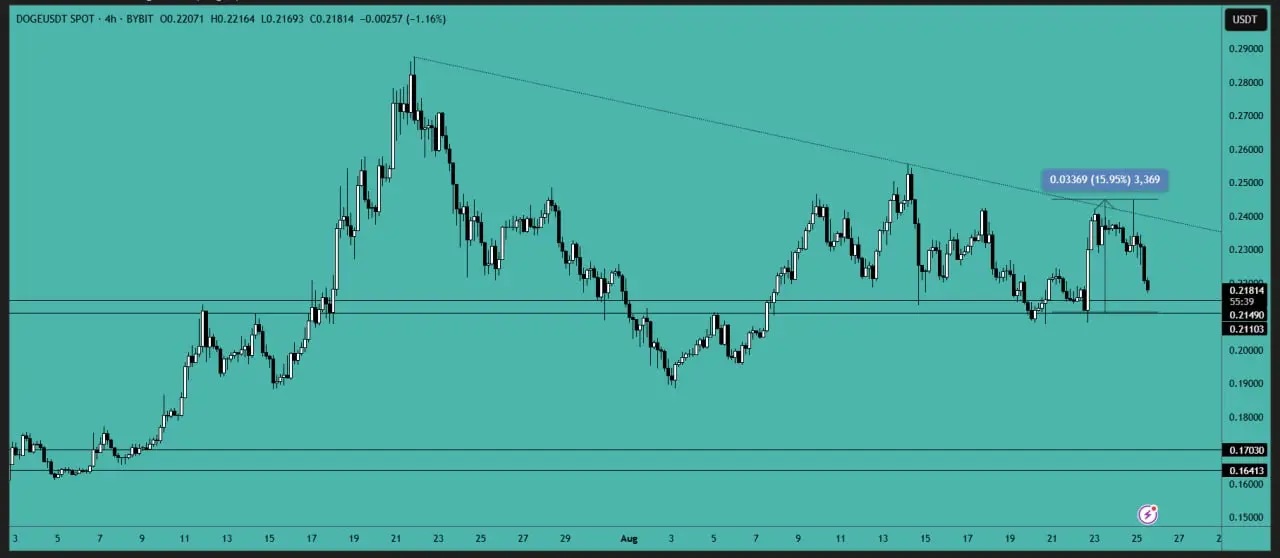
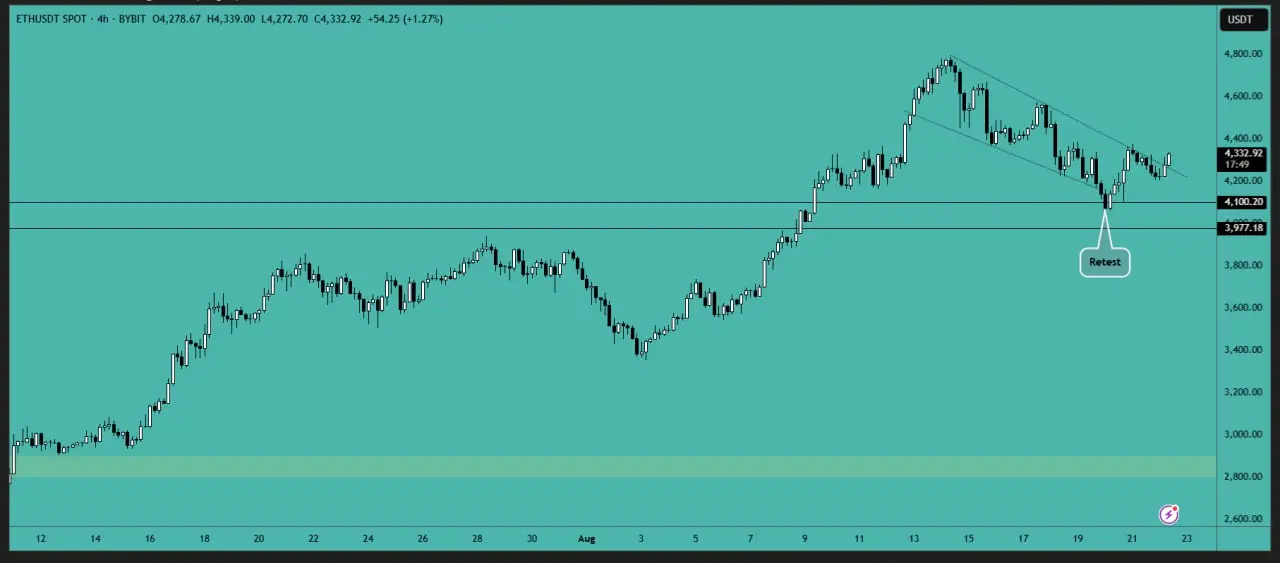
DOGE tested the support area and bounced back from it. The price has been rejected at the downtrend line and is now moving toward the support area again. You may consider adding more at this support level. A break above the downtrend line will determine the next phase for DOGE.
- Reward
- like
- Comment
- Repost
- Share
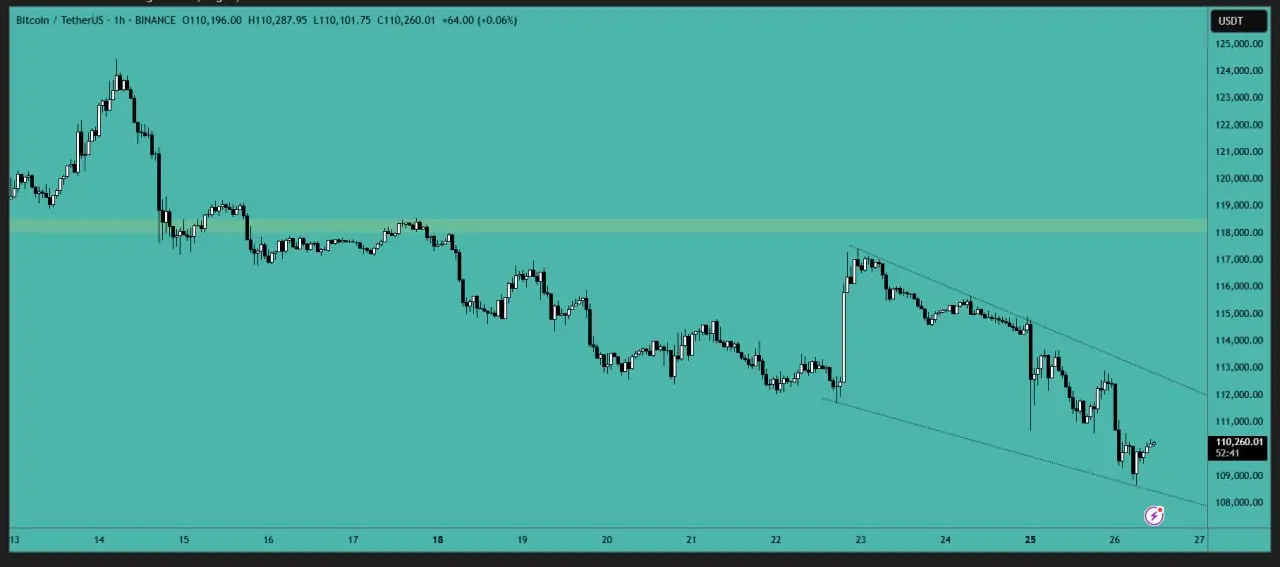
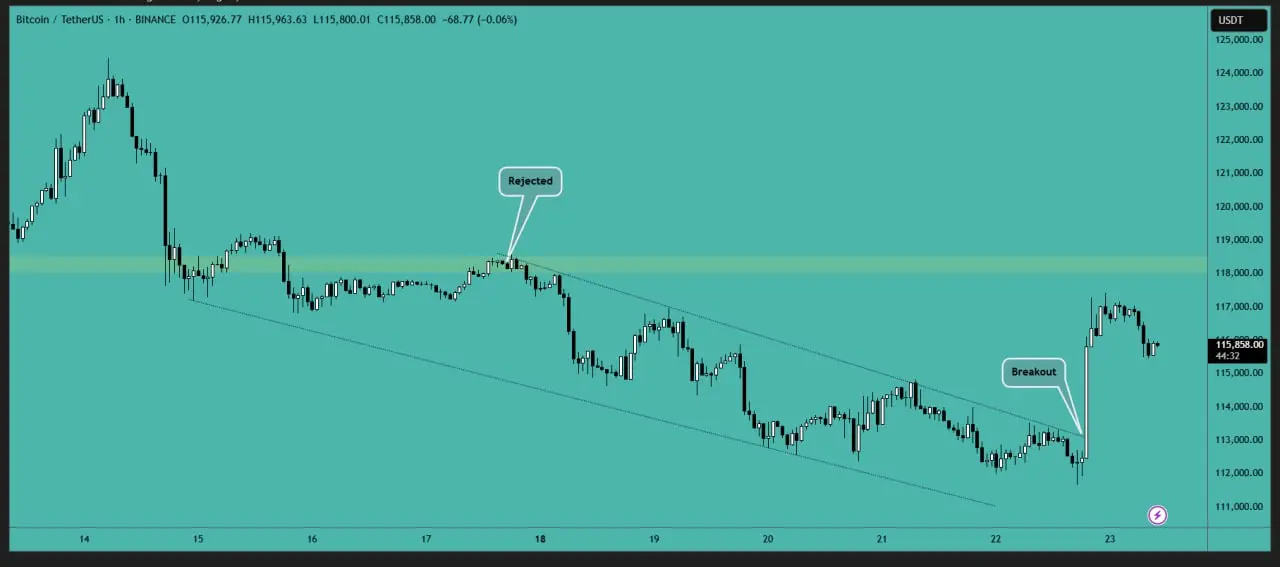
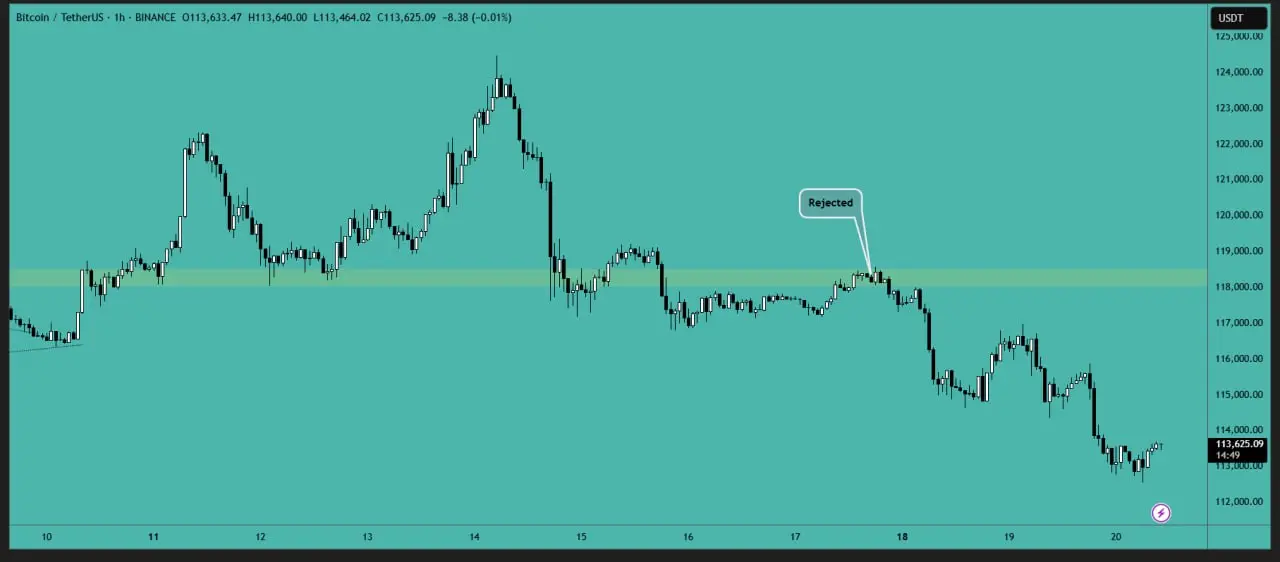
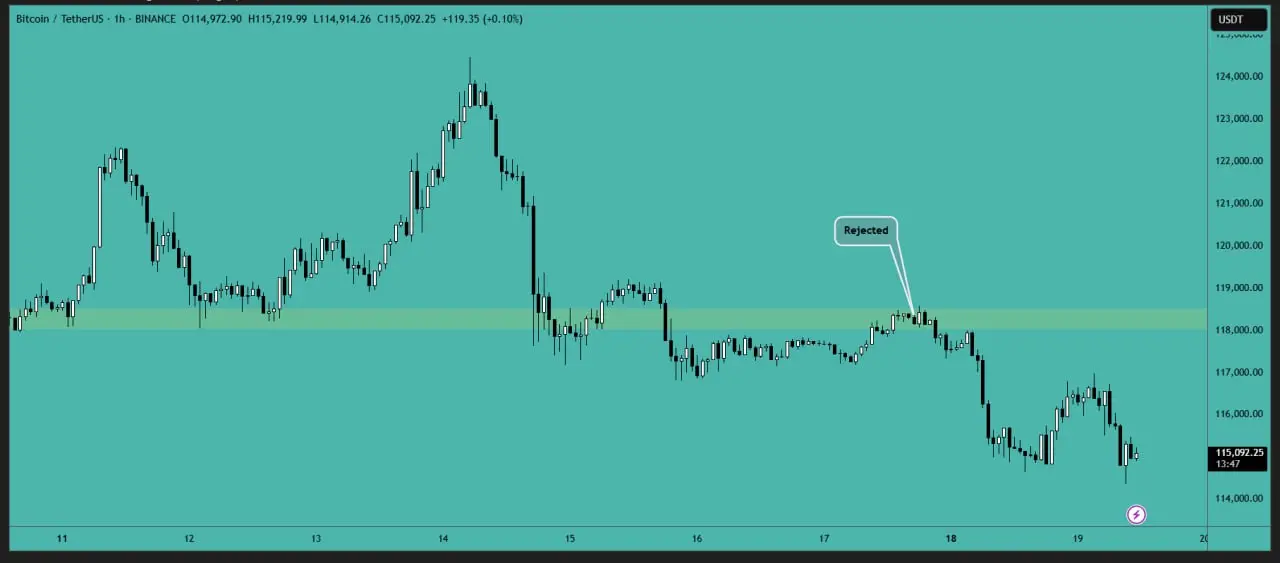
Bitcoin has broken out of the downtrend channel with a strong green candle. The next significant resistance level is in the $118,000-$118,500 range. Local support can be found in the $114,700-$115,000 area, and we may see a continuation of upward movement if the price remains above this level.
- Reward
- like
- Comment
- Repost
- Share
Bitcoin Profit-Taking Trends
We can identify three major waves of profit-taking:
Around the $70K breakout (2024)
During the $100K breakout (2024)
At the $122K ATH in July 2025
Each event reflected a strong investor appetite to lock in profits, but just as importantly, it highlighted an equally strong wave of demand ready to absorb that selling pressure.

- Reward
- like
- Comment
- Repost
- Share
Bitcoin has just presented us with a critical technical juncture. The failure to secure a daily close above the psychologically significant $115,000 level has triggered a sharp corrective move. The price has now found itself testing a major support confluence around **$112,600**. The reaction here is paramount for determining the next short-to-medium-term directional bias.
Let's break down the mechanics of this move and what to watch for.
The Technical Picture: A Battle at a Key Confluence
The current price action is far from random; it's a clash between bullish momentum and profit-taking pres
Let's break down the mechanics of this move and what to watch for.
The Technical Picture: A Battle at a Key Confluence
The current price action is far from random; it's a clash between bullish momentum and profit-taking pres
- Reward
- like
- Comment
- Repost
- Share
- Reward
- 1
- Comment
- Repost
- Share
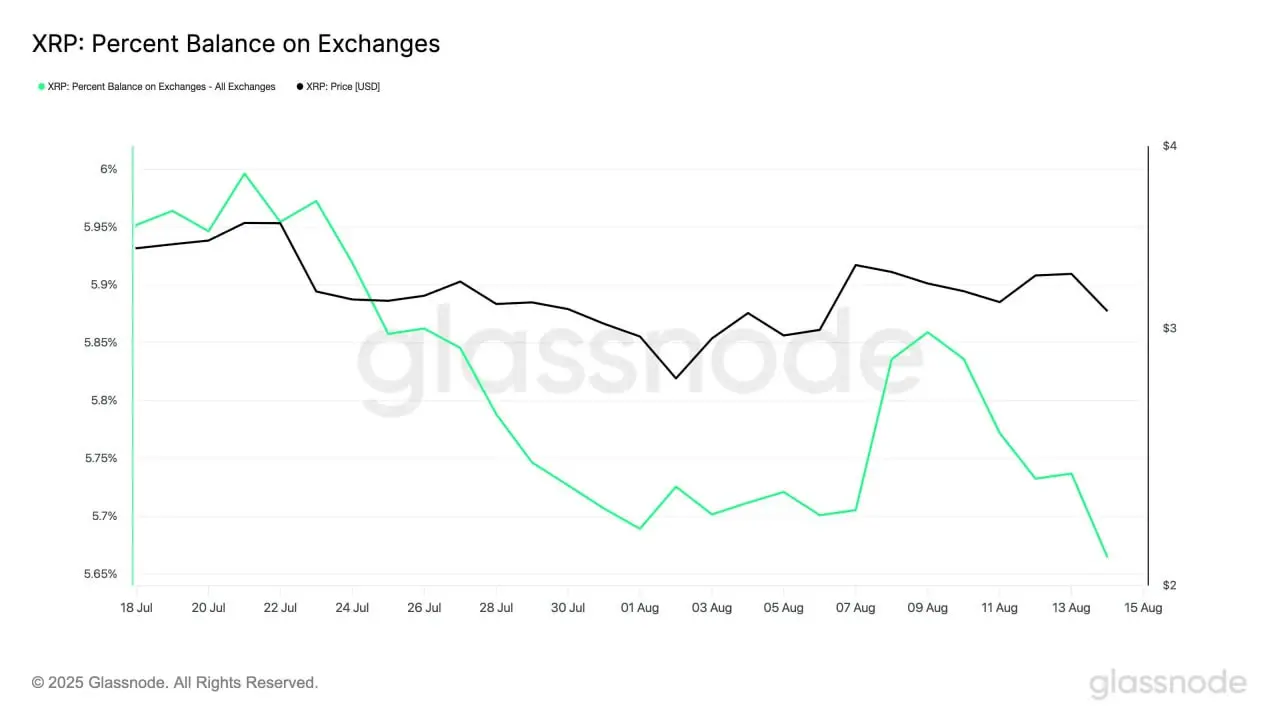
XRP Supply on Exchanges Hits One-Month Low!
The share of XRP held on centralized exchanges has dropped to just 5.66%, according to Glassnode — the lowest in a month and down by ~3% since August 9.
This sharp decline signals reduced selling pressure, as more investors are moving their holdings into self-custody wallets. Such a trend suggests growing confidence, stability, and possible upside potential in the coming weeks.
- Reward
- like
- Comment
- Repost
- Share
- Reward
- like
- Comment
- Repost
- Share
- Reward
- like
- Comment
- Repost
- Share
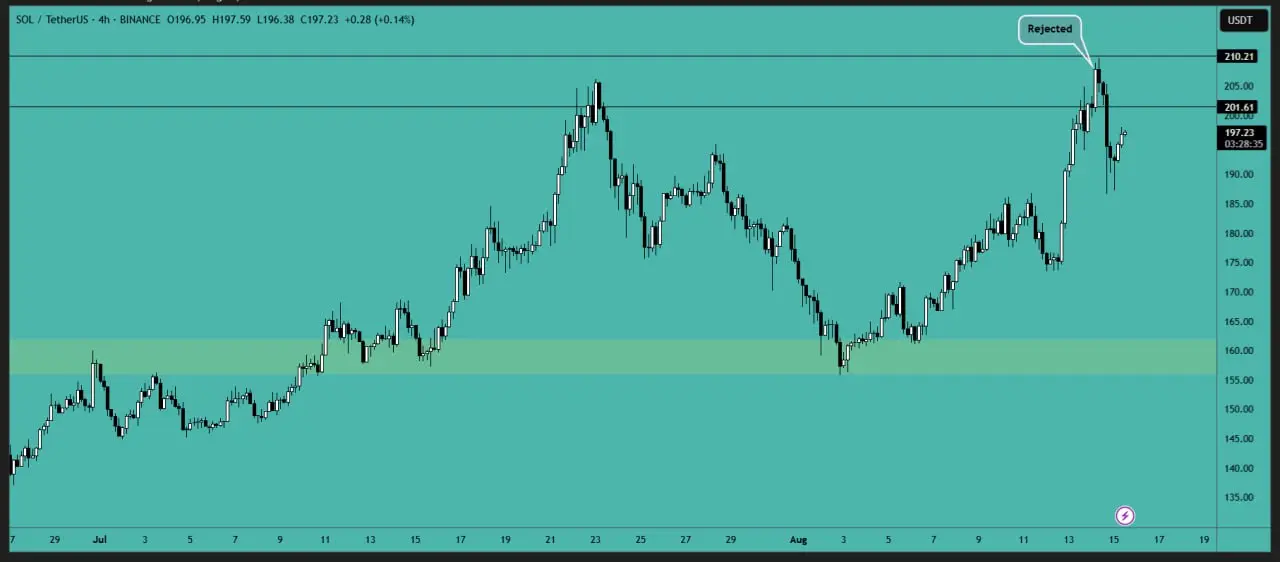
SOL has been rejected from the resistance area, and the price has not been able to break above it. You might consider adding more SOL around the support zone of $185-$188. We could see another attempt to move towards the resistance area. A breakout above this level would likely lead to significant upward movement.
- Reward
- like
- Comment
- Repost
- Share
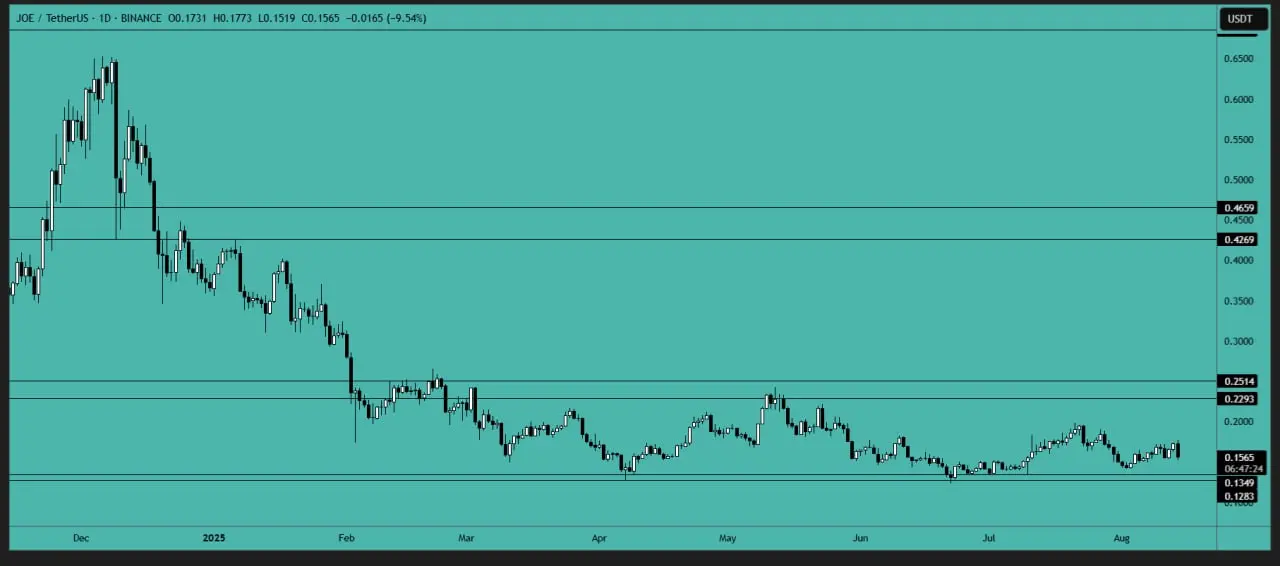
JOE analysis:
The price is currently fluctuating between the support and resistance areas, creating a no-trade zone. It's best to wait for a test of the support area. If the price breaks and holds above the $0.18 level, we may see a movement toward the resistance area, which would be the ideal point for new entries.
Resistance Area: $0.2290-$0.2520
- Reward
- like
- Comment
- Repost
- Share
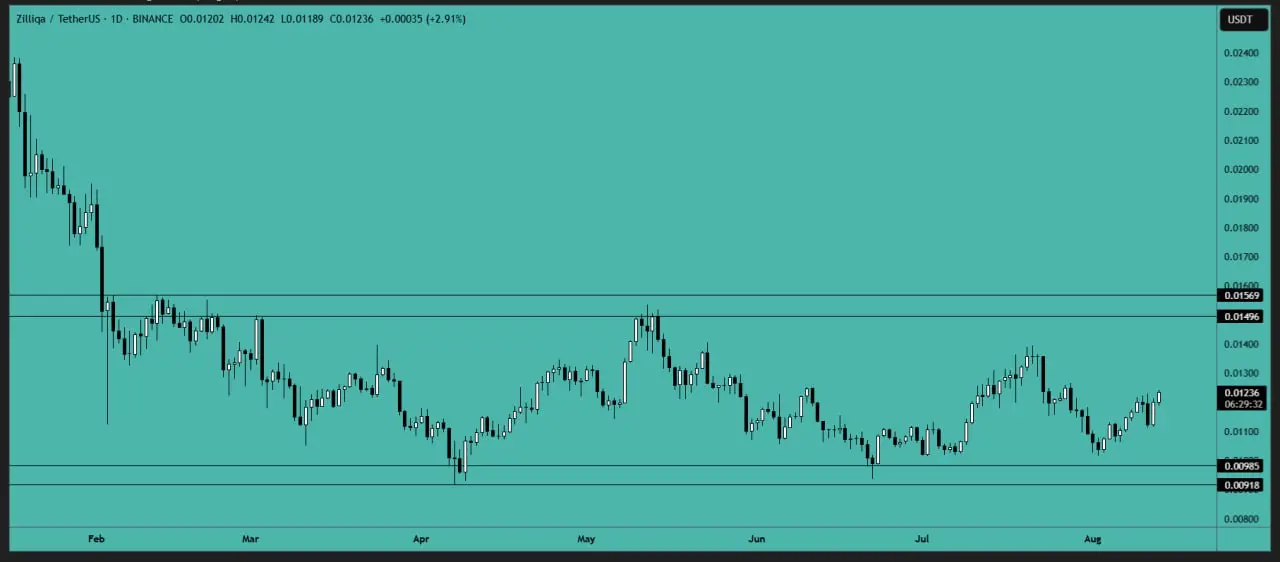
ZIL analysis:
The price has formed a double bottom pattern and is now gradually moving towards the resistance area. You can consider opening a long position at the local support level with a stop loss in place. We might see a test of the resistance area, and if it breaks above that, it will signal a bullish trend.
Local Support Area: $0.01150-$0.01170
Resistance Area: $0.01490-$0.01570
- Reward
- like
- Comment
- Repost
- Share
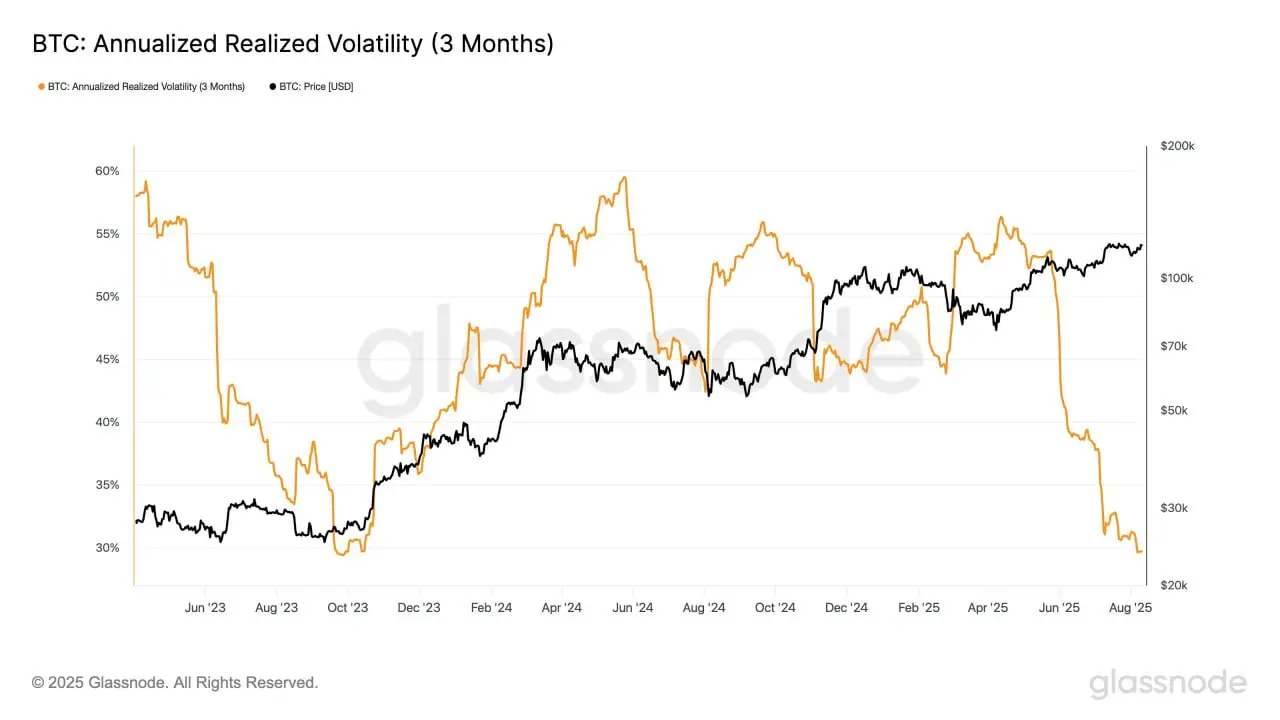
Bitcoin Volatility Update
At 29.79%, Bitcoin’s 3-month realized volatility is now at its lowest level since September 2023.
This cycle’s volatility profile is unique — mostly staying below 50%, unlike the previous two bull markets where 80–100% swings were common.
Low volatility in a bull run? That’s a rare combo worth watching closely
- Reward
- like
- Comment
- Repost
- Share
- Reward
- like
- 2
- Repost
- Share
GateUser-9a6632c4:
1000x Vibes 🤑View More